Treemap Visualisations
Treemaps turn the attribution output from interpret() into an interactive HTML chart. The chart is hierarchical — data sources, features, feature values — so you can zoom in from a high-level overview to individual value contributions.
Prerequisite
Run interpret() first. Treemaps read the JSON files in the output directory it produces.
Default Treemap
Point TreemapGenerator at the interpretation output directory and call plot_treemap():
from pathlib import Path
from monad.interpretability.treemap import TreemapGenerator

generator = TreemapGenerator(
    interpretability_files_path=Path("./interpretations"),
)

generator.plot_treemap(
    output_file_path=Path("./treemap.html"),
)
Open the saved HTML file in a browser — it is fully interactive (hover, zoom, pan).
Reading the treemap
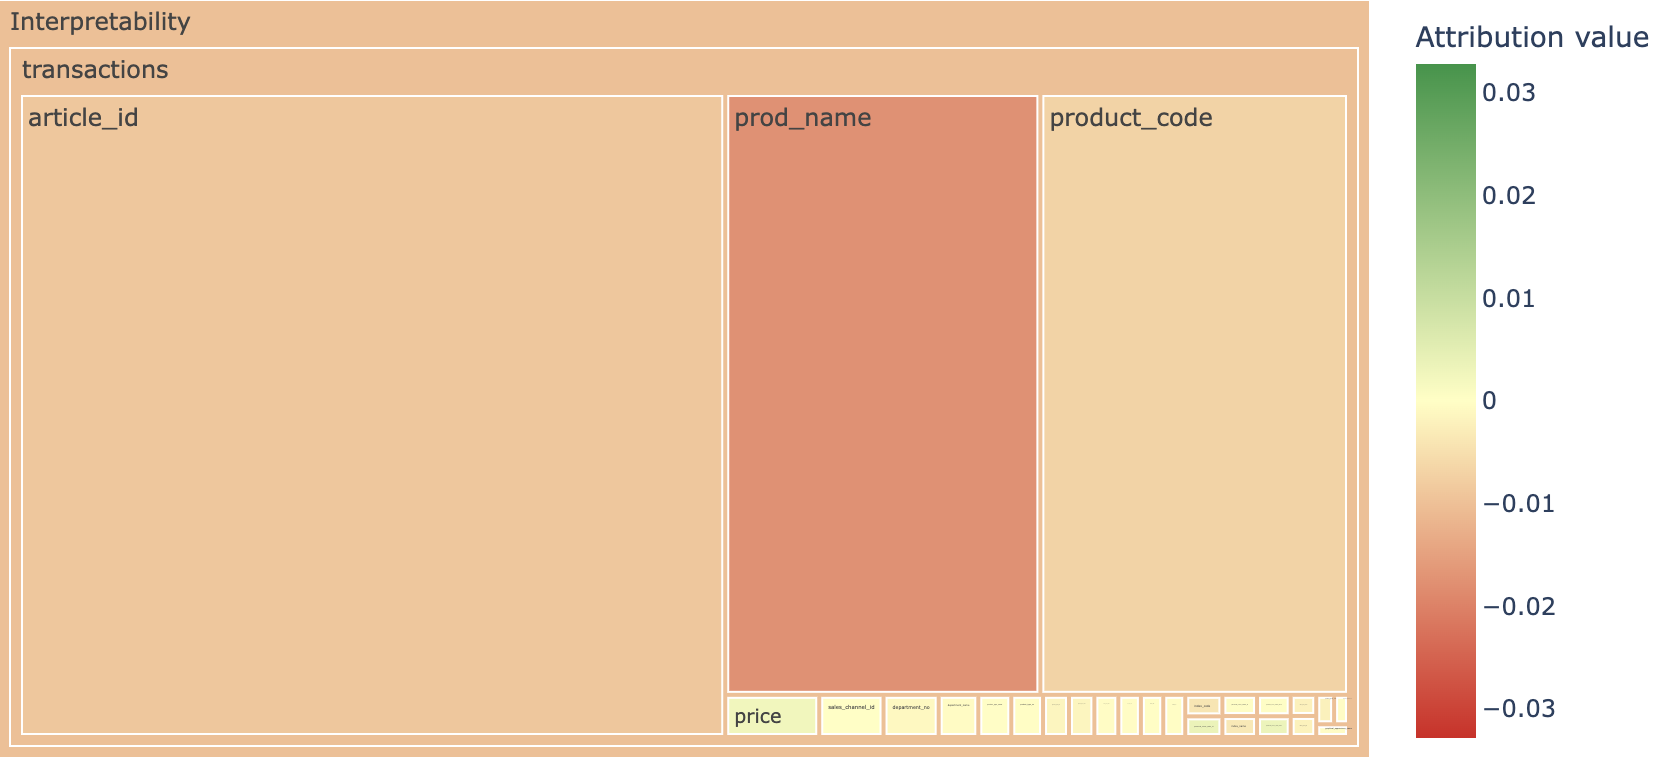
The top level shows feature importance within each data source. Area encodes the magnitude of the attribution; color encodes the direction (green = positive, red = negative).
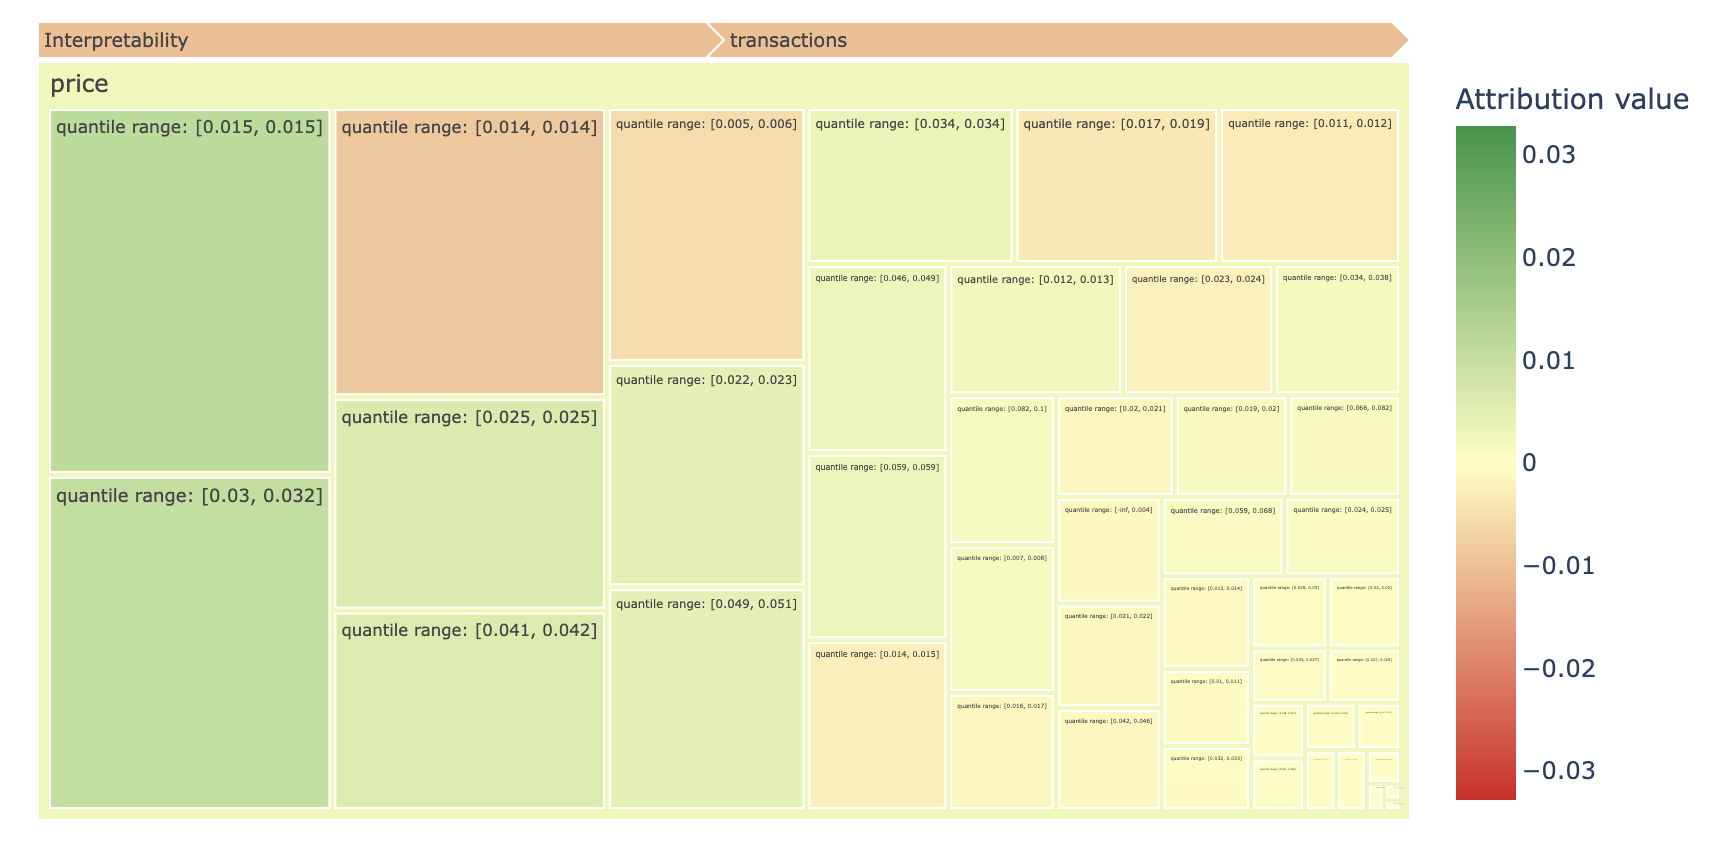
Click a feature to drill into individual value attributions. Here the price feature is expanded to show quantile-range contributions:
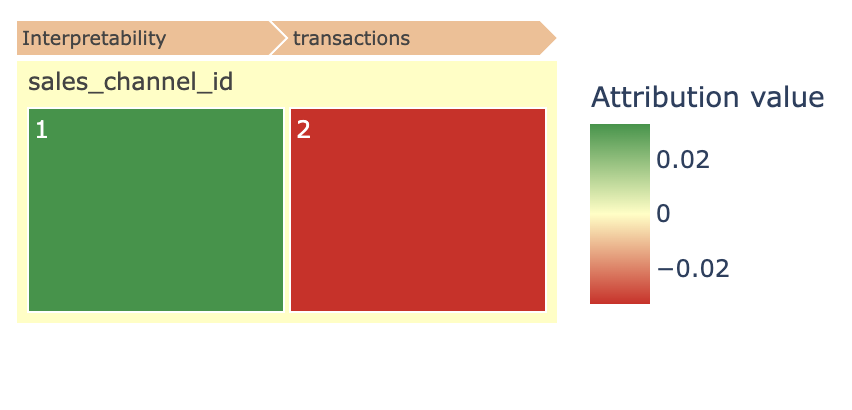
For categorical features the picture is simpler — each value gets its own tile with a clear positive or negative attribution:
Performance Tuning
Large datasets with many feature values can make the chart slow to render. Use these parameters to reduce the volume:
n_largest_per_feature— maximum values shown per feature (default1500)n_largest— maximum total values across all featuresmax_depth— hierarchy depth rendered at once (default3; set to-1for all levels)
generator.plot_treemap(
    output_file_path=Path("./treemap.html"),
    n_largest_per_feature=500,
    max_depth=2,
)
Custom Hierarchy
The default treemap groups by data source, then feature, then value. When you need a domain-specific grouping (e.g., product category / brand / item), define a TreemapHierarchy:
from monad.interpretability.treemap import TreemapGenerator, TreemapHierarchy

hierarchy = TreemapHierarchy(
    levels=["category", "brand", "product_id"],
    hierarchy_path=Path("./data/product_hierarchy.csv"),
    feature_values_importance_path=Path(
        "./interpretations/transactions/article_id/values_importance.json"
    ),
    entity_name_column="product_name",
)

generator = TreemapGenerator(hierarchy=hierarchy)
generator.plot_treemap(output_file_path=Path("./custom_treemap.html"))
The CSV at hierarchy_path maps leaf-level values to their parent groupings. See Reference: Interpretability for field details.