
Interpreting your model's predictions
Understanding your prediction drivers
Check This First!This article refers to BaseModel accessed via Docker container. Please refer to Snowflake Native App section if you are using BaseModel as SF GUI application.
BaseModel provides possibility to demystify black-box downstream models and provide explanations for their predictions. We're using our modification od Integrated Gradients method from this paper, thus for each data source, feature, and feature value we can provide its importance value a.k.a. attribution.
In order to run interpretability for a model, you only need to run a python script below, adjusting some parameters as needed (the example below generates results for our Kaggle H&M example:
from pathlib import Path
from datetime import datetime

from monad.config.time_range import TimeRange
from monad.ui.config import DataMode
from monad.ui.interpretability import interpret

interpret(
    output_path=Path("<path/where/results/should/be/saved>"),
    predictions_path=Path("<path/to/predictions/my_predictions.tsv>"),
    checkpoint_path=Path("<path/to/downstream/model/checkpoints>"), # location of scenario model,
    device="cpu",
    limit_batches=100,
    target_index=0,
    prediction_date=datetime(2023, 8, 1),
)
The arguments of the interpret are required to specify the save location and customize the interpretability results.
| Parameters |
|---|
- output_path : Path
No default
Where interpretability results should be stored. - predictions_path : Path
No default
Path to your saved predictions. - checkpoint_path : Path
No default
Path to the model checkpoint - the model that was used to run predictions. - device : str
No default
Device to compute the attributions on. Most commonly"cpu"or"cuda"/"cuda:X"where X is the device number. - target_index: str, optional
Default: None
Output indices for which interpretations are computed. For multiclass and multi-label classification should be the id number of a class. No target index is needed for recommendation. - limit batches: int, optional
Default: None
Number of batches to compute attributions. If None all batches will be used. Defaults to None. Limiting batches will decrease computation time. - classification_resample : bool
Default: False
If data should be resampled to obtain balanced classes. Defaults to True. Applicable only for classification models. - recommended_value : str, optional
Default: None
Value of recommended entity for which the interpretation should be generated. Applicable only for recommendation models. - group_size : int
Default: 500
Maximal number of samples to take from each group. For classification resampling, a group size is a size of one class. For recommendation, group size is the total number of observations that have recommended value among top predictions. If a group has fewer observations than value of this parameter, all available ones will be taken. Parameter used only if classification_resampling is set to True or recommended_value is set. - prediction_date: datetime.datetime, optional
Default:datetime.datetime.now()
The date for which the predictions should be interpreted. Defaults to current date.
Additonally, as kwargs, you can pass any parameters defined in data_params block in YAML configuration to overwrite those used during the training of the scenario model.
Understanding results
Interpretability output files are plots and JSON files with the following structure.
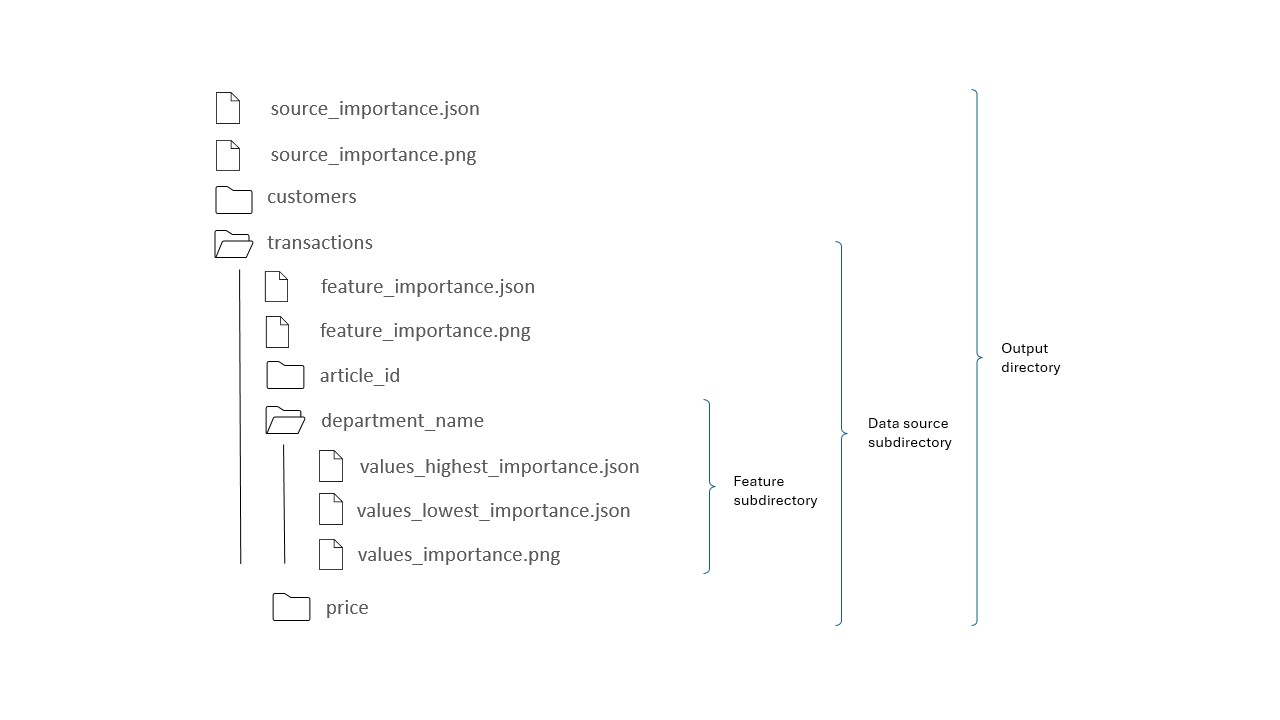
Output directory
Files source_importance.json and source_importance.png contain attributions of each data source. Each folder in the output directory corresponds to a separate data source.
Data source subdirectory
This directory holds files feature_importance.json and feature_importance.png which contain importance of features in this particular data source. In addition to the features, the files include an entry named "Events frequency" which stands for the importance of frequency and patterns of occurrence of events. Each folder in the data source subdirectory corresponds to a separate feature.
Feature subdirectory
Files values_highest_importance.png and values_lowest_importance.png contain top 10 highest and lowest importance values while file values_importance.json contains all importance values.
Plots
BaseModel interpretability produces bar PNG files with plots where x-axis shows the importance value.
Feature value importance
Plots below show top highest and lowest values for feature department_name, positive interpretability value means positive impact on model's prediction. Let us consider a churn model. Having transactions with items from Swimwear department increases the chance of a churn while buying items from Blouse department decreases churn chance.
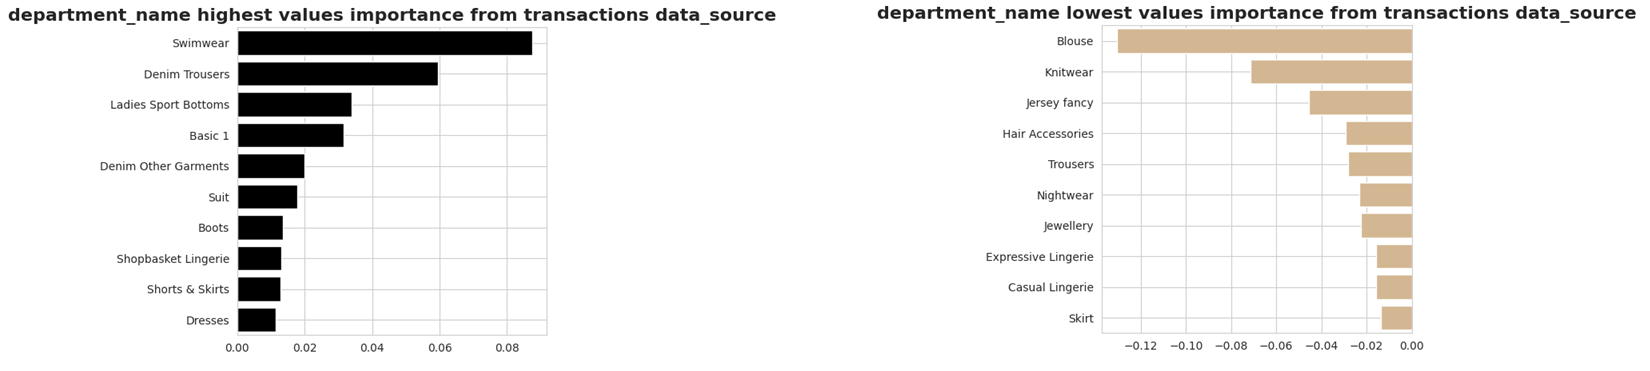
NoteThe feature with higher absolute importance value in general is more important for model's prediction than feature with lower absolute value. However, be aware that the importance is averaged over a number of entities, so the importance ranking of features may be different for each individual entity (for example customer).
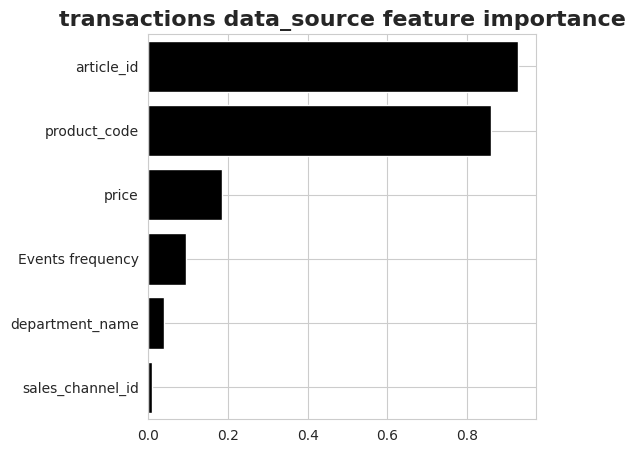
Feature importance
The following plot describes the importance of features from transactions data source. The feature importance is a sum of feature value attributions and the impact of value variability over time. An additional entry "Events frequency" describes the importance of frequency and patterns of occurrence of events that cannot be assign to a particular feature.
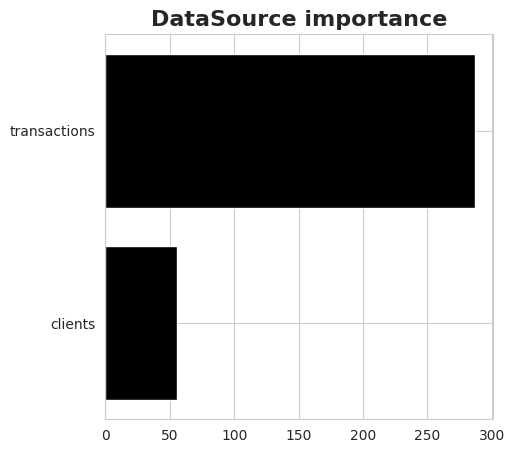
Data source importance
The last plot shows the importance of data sources. The difference from the other plots is that the importance of a data source can only be positive since it is calculated as a sum of absolute values of feature importance.
JSON files
The output directory contains also JSON files with interpretability values for all data sources, features and feature values. Example below shows the content of such file with data source attributions.
{
"transactions": 2.929590956499773,
"customers": 3.479593275048298e-09
}
Did you know?This article covers basic interpretability, for more advanced tools read Treemap visualizations and Single entity interpretations.
Updated 6 months ago