
Treemap visualizations
Check This First!This article refers to BaseModel accessed via Docker container. Please refer to Snowflake Native App section if you are using BaseModel as SF GUI application.
Treemap allows for some interactivity when exploring the results and is quite simple to understand. This article explains and shows how to generate default plots and plots with hierarchy predefined by a user.
NoteGeneration of Treemap requires prior creation of interpretability results with
interpretfunction described in Interpreting your model's predictions.
Default Treemap
The code snippet below demonstrates how to generate basic Treemap visualizations.
from pathlib import Path
from monad.ui.interactive_interpretability import TreemapGenerator


# generate treemap visualization from saved interpretability results
tg_from_files = TreemapGenerator(
    # path should match the output_path passed to the interpret function
    interpretability_files_path="<path/where/interpret/results/were/saved>",
)

tg_from_files.plot_treemap(
    # path to the .html treemap file to be saved
    output_file_path="<path/to/html/treemap/file/to/save.html>",
)
NoteThe Treemap HTML file saved with
plot_treemapfunction is interactive. Below, for ease of understanding, we explain the Treemap in static screenshots.
The Initial general view will look more or less like this:
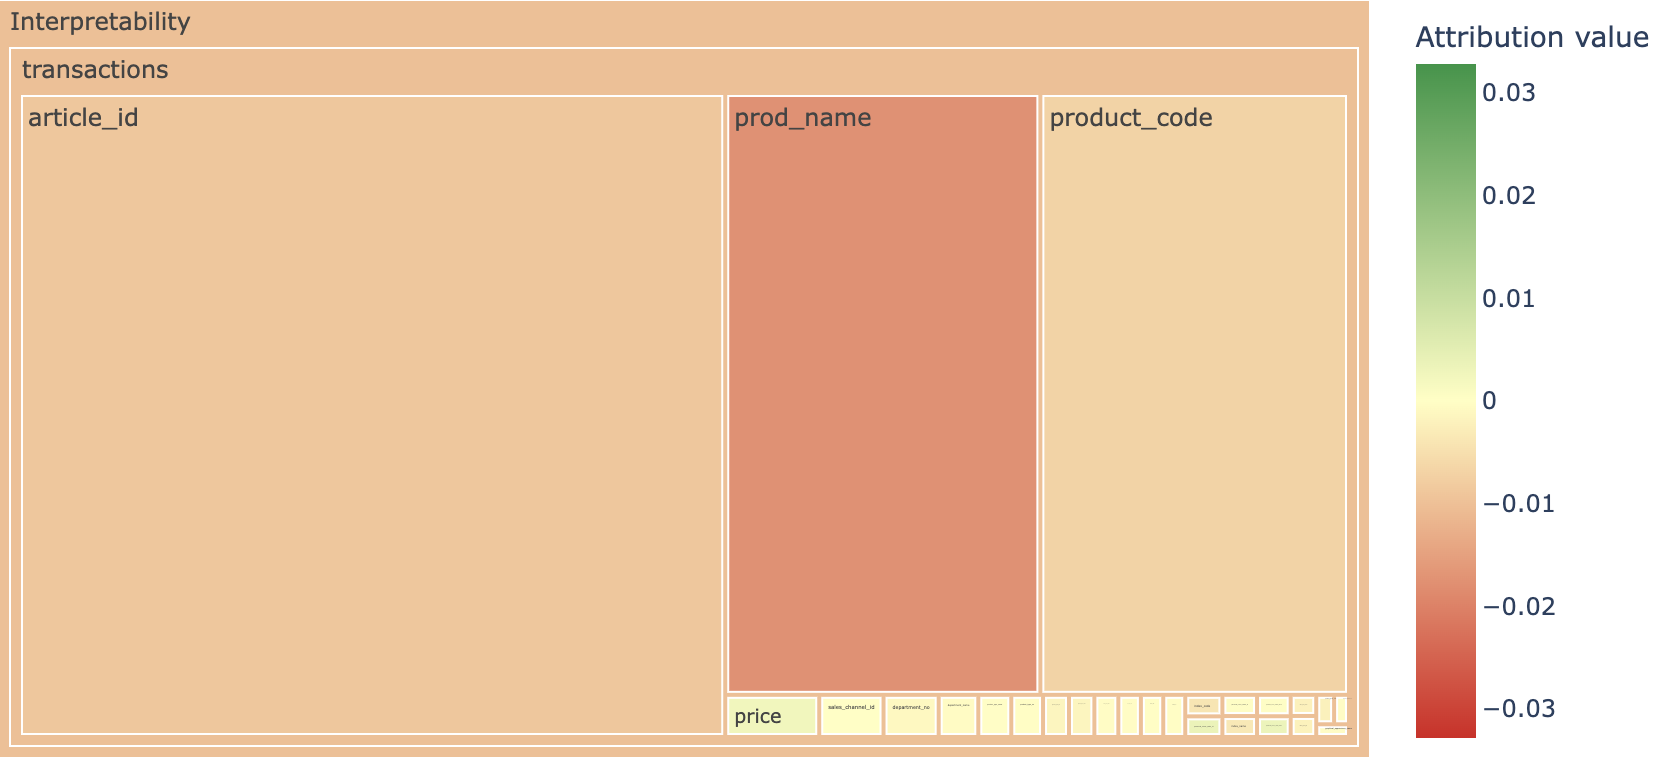
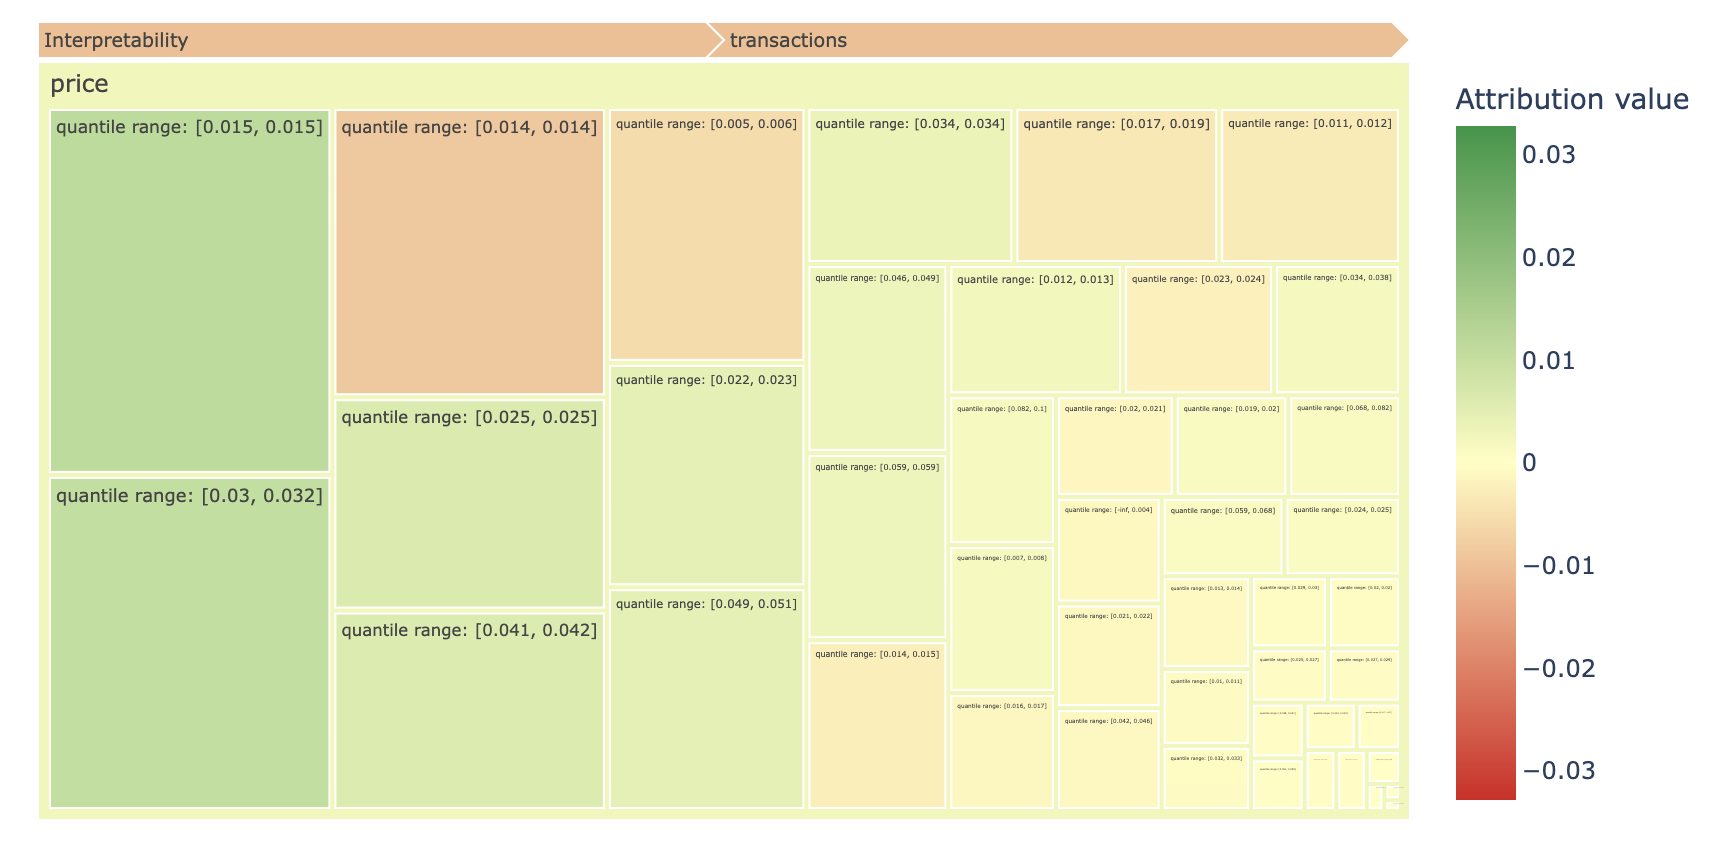
It shows different features and their relative feature importance - magnitude and direction. It is possible to click any of the blocks to drill into more details, for example, if I click the price block I get the following view:
There are 2 important parts to the interpretation here:
-
attribution color- describes the direction of the attribution. Green means positive influence on final prediction, red means negative influence. For example, if we drill down intosales_channel_id: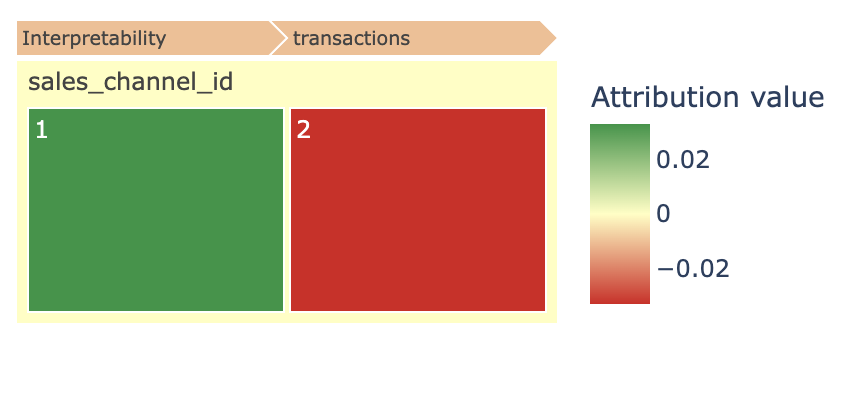
We can see that transactions via
sales_channel_id= 1 is attributed with increased probability of churning in the future, whilesales_channel_id= 2 - decreases probability of churn -
attribution value- this is a percentage influence - how many percentage points does a given feature increase/decrease probability of churn.
To produce Treemaps we use TreemapGenerator class.
| Parameters |
|---|
- interpretability_files_path: Path
No default
Path to interpretability attributions generated withinterpretfunction. If provided, treemap based only on training data will be generated. Treemap levels will be as follows: data sources, features, feature values. - hierarchy: TreemapHierarchy
No default
Custom definition of a Treemap hierarchy. If provided, Treemap based on defined hierarchy will be generated.
Exactly one of interpretability_files_path and hierarchy parameters should be provided.
Generating Treemap as an HTML file
To get treemap in HTML version we call plot_treemap method on an object of class TreemapGenerator.
| Parameters |
|---|
- output_file_path: Path
No default
Path to an output HTML file where Treemap should be saved. - n_largest_per_feature: int, optional
Default: 1500
Maximum number of the largest attribution values per feature to include on the plot. Rest of the feature values will be summed up and displayed as one element named rest_of_feature_values. If None all attribute values will be shown. - n_largest: int, optional
Default: None
Maximum number of largest attribution values to include on the plot. Rest of the feature values won't be on the plot. If None all attribute values will be shown. - exclude_positive_attributions: bool
Default: False
If positive attributions should be excluded from the plot. - exclude_negative_attributions: bool
Default: False
If negative attributions should be excluded from the plot. - max_depth: int
Default: 3
Defines the number of levels rendered at one time on a Treemap. If set to -1 will render all the hierarchy levels. Defaults to 3.
Data with many feature values can cause the output chart to load slowly. To improve performance, you can use the
n_largest and n_largest_per_feature parameters to limit the number of data shown on the chart or decrease max_depth value.
Treemap with hierarchy
The basic order of levels on the Treemap may not be sufficient for in-depth analysis, therefore we have provided the option to define custom levels on the treemap.
To define hierarchy for a Treemap you need to use TreemapHierarchy class.
| Parameters |
|---|
-
hierarchy_path: Path
No default
Path to a csv file that defines hierarchy. It should contain columns corresponding to the levels of hierarchy on a plot. Each row should define mapping from the last hierarchy level to other levels. The column with the last hierarchy level should contain unique values. Example content of a file is demonstrated by a table below which corresponds to the hierarchy["level_1_category", "level_2_brand", "level_3_product_id"].level_1_category level_2_brand level_3_product_id product_name category A brand A 1 product 1 category A brand B 2 product 2 category A brand B 3 product 3 category B brand A 4 product 4 -
levels: List[str]
No default
List of hierarchy levels that should be used on a treemap. From the most general level to the most specific one. Usually last hierarchy level is product id. Last hierarchy level should be in the model training data, other levels are independent of the training data. -
feature_values_importance_path: Path
No default
Path to a JSON file with feature value importances corresponding to feature values from the last hierarchy level. File with importances should be one of the files generated with theinterpretfunction described in Interpreting your model's predictions. -
entity_name_column: str, optional
Default: None
Column name from csv file with hierarchy path. This column should contain names corresponding to the last hierarchy level that should be used on the Treemap. If None, original values of the last hierarchy level will be used.
The first few lines of csv file and code snippet bellow demonstrate how to generate Treemap the with predefined hierarchy.
| Example |
|---|
department_name, section_name, colour_group_name, article_id, prod_name
Jersey Basic, Womens Everyday Basics, Black, 0108775015, Strap top
Jersey Basic, Womens Everyday Basics, White, 0108775044, Strap top (1)
Jersey Basic, Womens Everyday Basics, Off White, 0108775051, Strap top (2)
Clean Lingerie, Womens Lingerie, Black, 0110065001, OP T-shirt (Idro)
Clean Lingerie, Womens Lingerie, White, 0110065002, OP T-shirt (Idro)from pathlib import Path
from monad.ui.interactive_interpretability import TreemapGenerator, TreemapHierarchy
# build treemap hierarchy and generate visualization
hierarchy = TreemapHierarchy(
# path to the csv file defining hierarchy levels
hierarchy_path=Path("<path/to/csv/file/with/hierarchy.csv>"),
# hierarchy levels (from most general to most specific)
levels=["department_name", "section_name", "colour_group_name", "article_id"],
# path to feature values importance data produced by the interpret function
feature_values_importance_path=Path(
"<path/where/interpret/results/were/saved>",
"transactions",
"article_id",
"values_importance.json",
),
# name of the column representing entity names
entity_name_column="prod_name",
)
tg_from_hierarchy = TreemapGenerator(hierarchy=hierarchy)
tg_from_hierarchy.plot_treemap(
# path to the .html treemap file to be saved
output_file_path=Path("churn_hierarchy_treemap.html"),
max_depth=4,
)
The code above will result in the chart below with the hierarchy of levels as follows:
department_name -> section_name -> colour_group_name -> article_id / prod_name
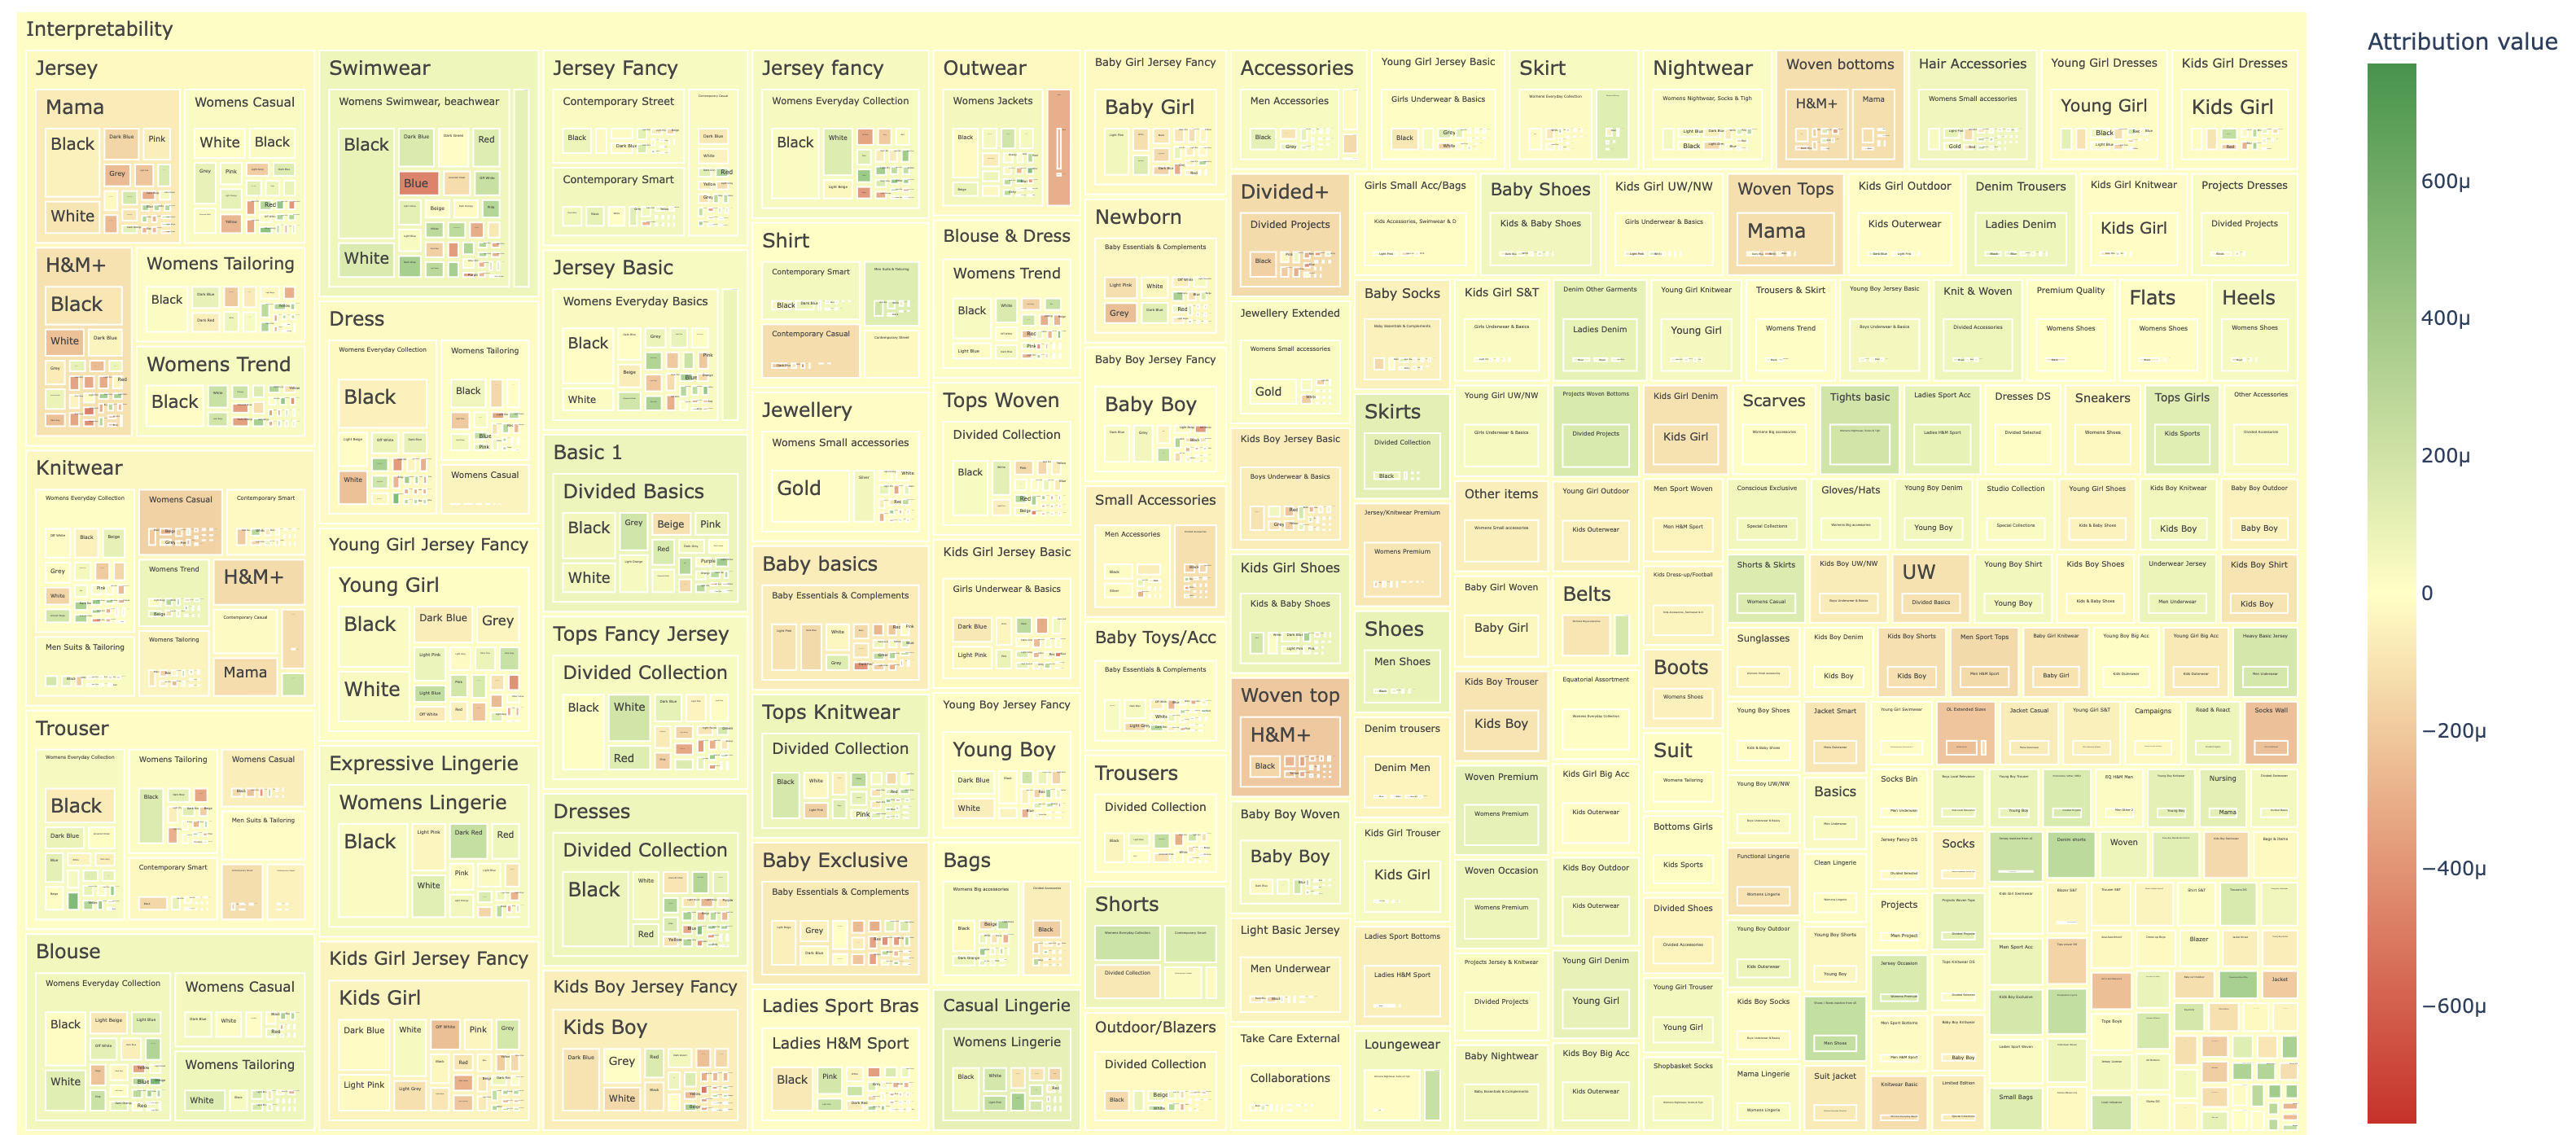
We are able to explore any of the blocks in more detail, for example Trousers and then Womens Casual:
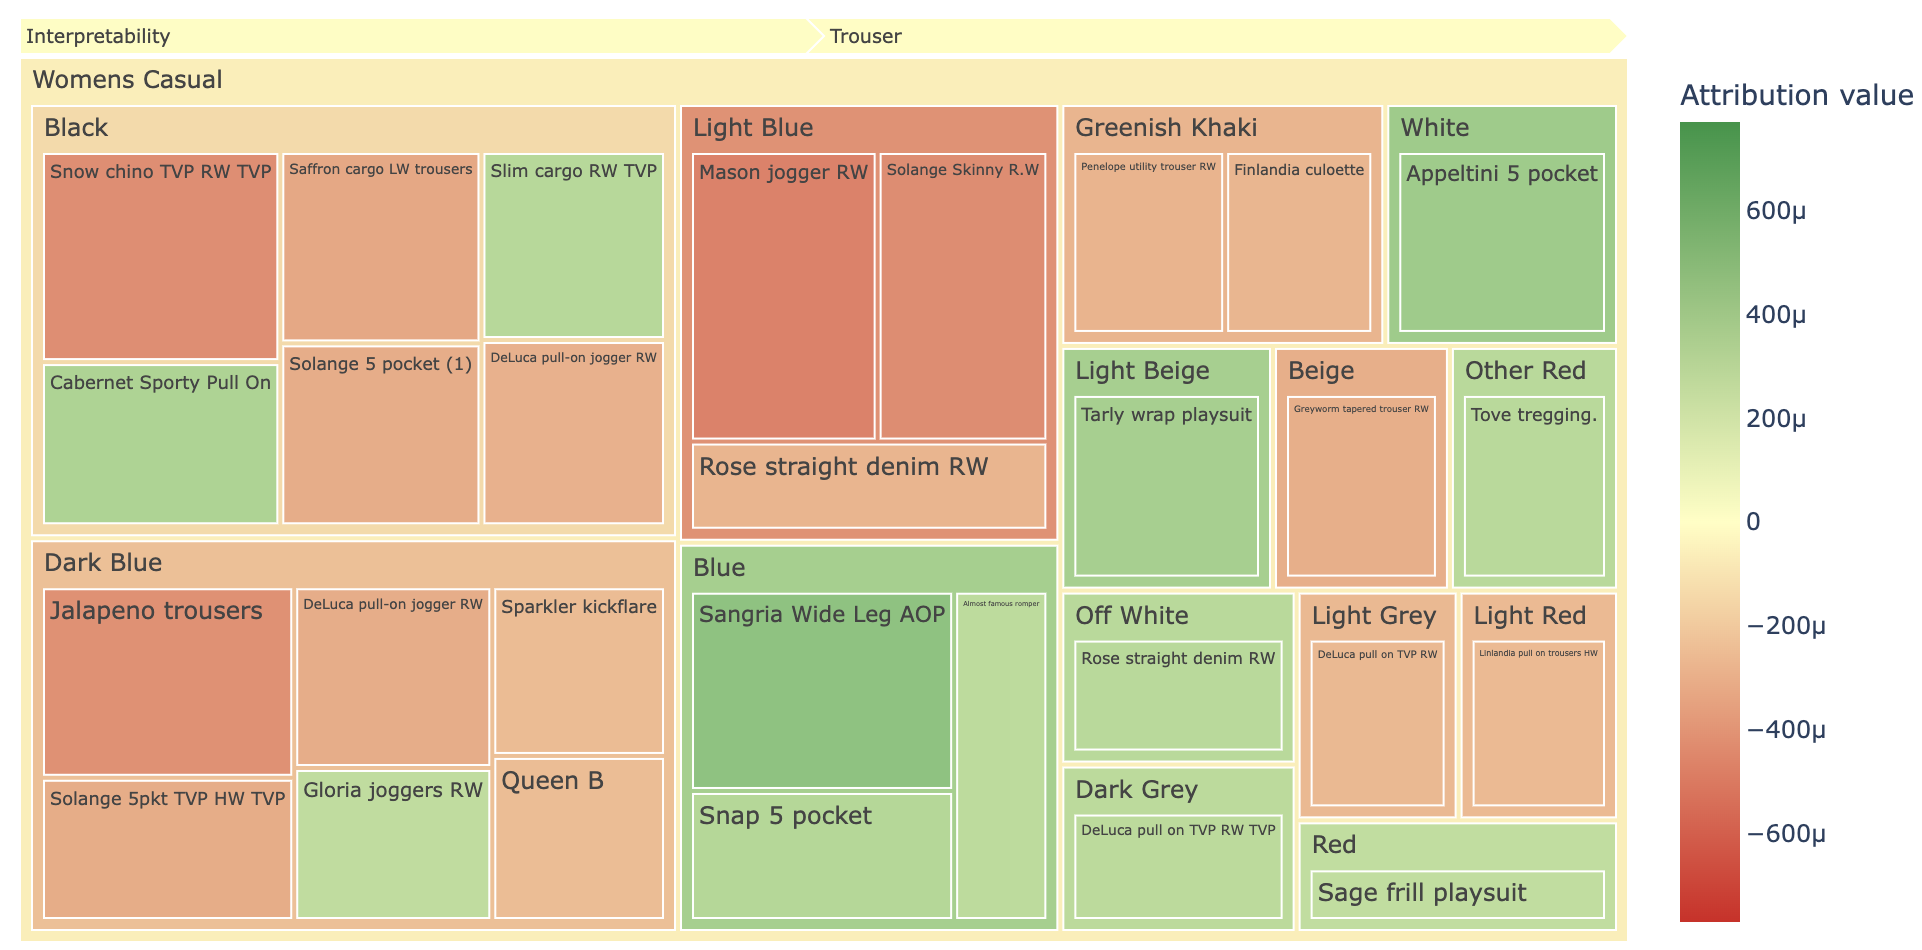
The interpretation is the same as in TreeMap without hierarchy here:
-
attribution color- describes the direction of the attibution. Green means positive influence on final prediction, red means negative influence. For example we can see that transactions of light blue trousers attibuted negatively towards churn, while white ones attributed positively the probability of churn. -
attribution value- this is a percentage influence - how many percentage points does a given type ofproduct_nameincrease/decrease probability of churn.
Updated 5 months ago