
Tracking with MLFlow
Learn how to track your BaseModel work with MLFlow
Check This First!This article refers to BaseModel accessed via Docker container. Please refer to Snowflake Native App section if you are using BaseModel as SF GUI application.
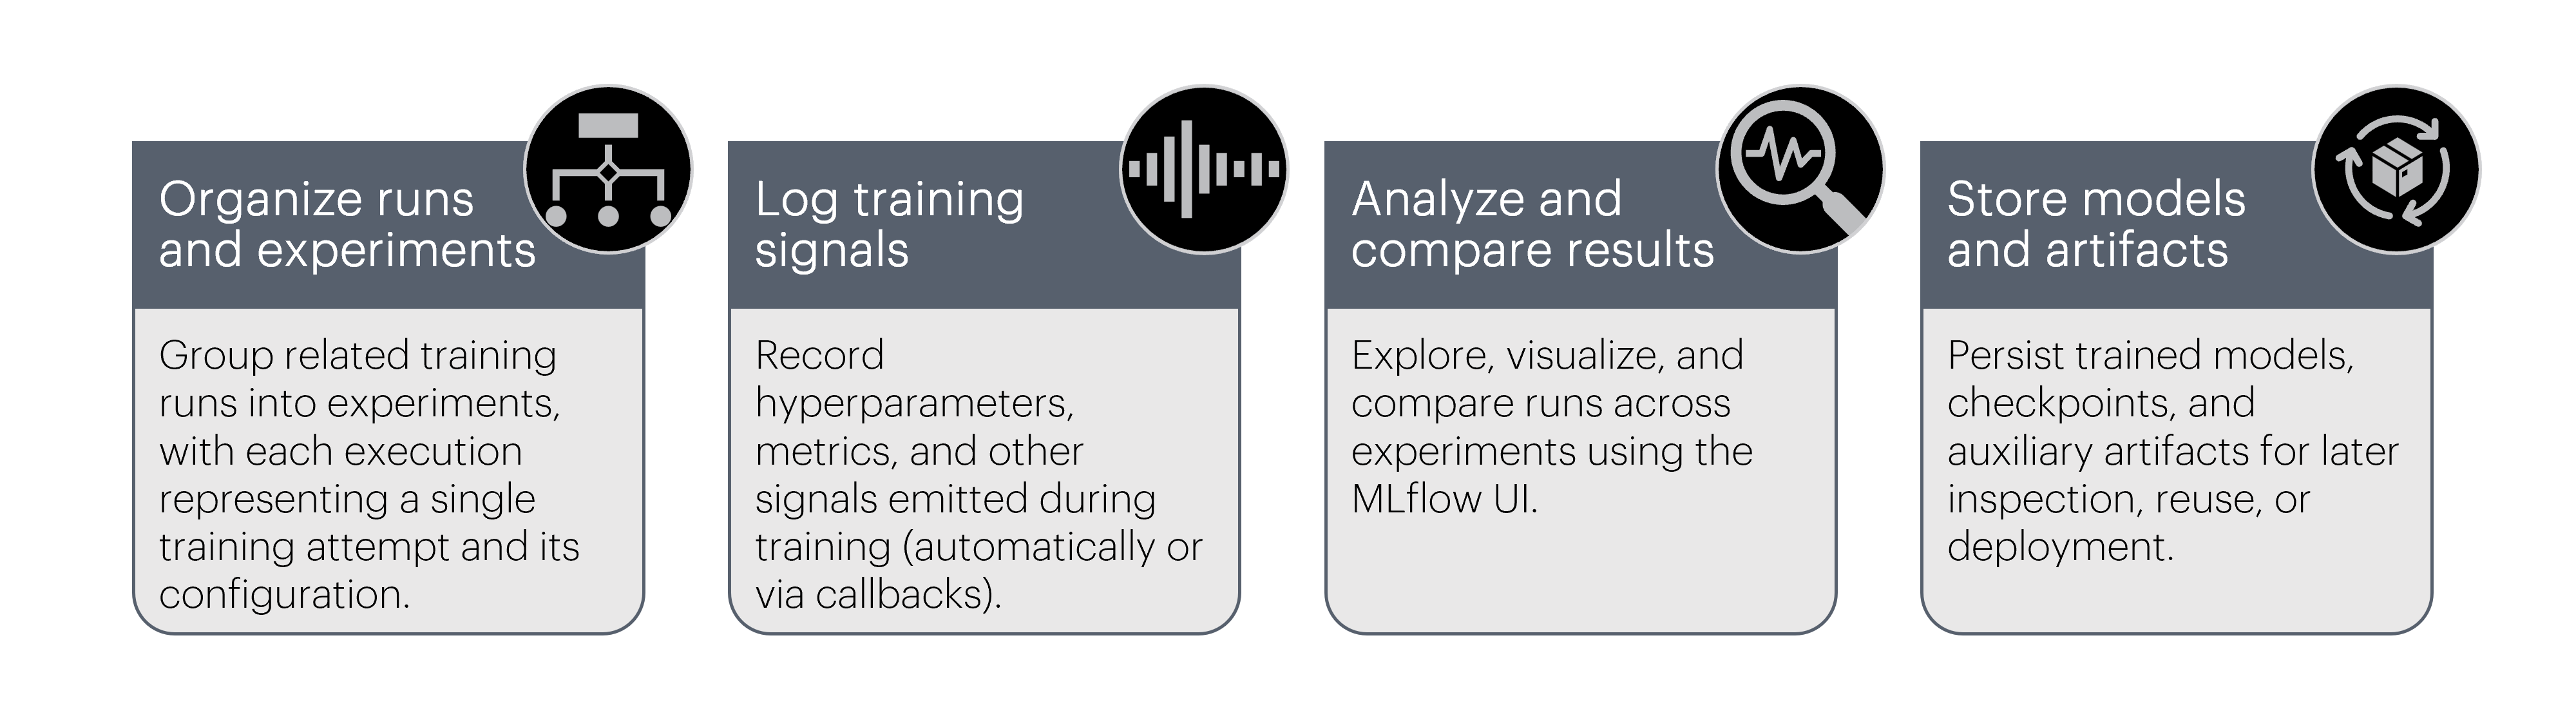
Experiment tracking is the practice of recording metrics, hyperparameters, configurations, and artifacts produced during training to enable analysis, comparison, and visual inspection of runs.
BaseModel tracking capabilities with MLFlow
Key concepts:
A single execution of training. Metrics, parameters, and artifacts are logged at the run level.
A logical container that groups related training runs (e.g. all foundation model pretraining runs).
Link to the MLflow backend where runs are stored. This can be a local filesystem, a remote MLflow server, or a managed backend.
To enable tracking your experiments and runs with MLFlow you can either utilize PyTorch's MLFlowLogger or MLFlow's native logging features.
Tracking with PyTorch MLFlowLogger
MLFlowLoggerThe simplest method to track BaseModel work with MLFlow. Key steps:
- import
MLFlowLoggerclass, - instantiate the logger
- pass it to
pretrainorload_from_foundation_modelrespectively.
BaseModel passes the provided logger directly into the underlying PyTorch Lightning trainer, so default metrics, parameters, and artifacts are logged automatically without additional configuration.
from pathlib import Path
from pytorch_lightning.loggers import MLFlowLogger # import logger class
from monad.ui import pretrain

mlf_logger = MLFlowLogger(
    tracking_uri="sqlite:////path/to/mlflow/storage/mlflow.db", # put your backend store for experiments
    experiment_name="basemodel-experiment-name", # typically a parent for different runs
    run_name="fm-pretrain-v1", # name particular run
)

pretrain(
    config_path=Path("path/to/config.yaml"),
    output_path=Path("path/to/store/pretrain/artifacts"),
    pl_logger=mlf_logger, # pass the logger
)
Tracking with native MLflow logging
To use native MLFlow logging you need to:
- Import
mlflowmodule and itspytorchsubmodule, - Set the backend store and experiment name,
- Initiate automatic logging,
- Start (or resume) an MLflow run, then call
pretrain()ortrainer.fit()inside it, - And optionally, log extra artifacts after training finishes.
from monad.ui import pretrain
import mlflow
import mlflow.pytorch

mlflow.set_tracking_uri("sqlite:////path/to/mlflow/storage/mlflow.db")
mlflow.set_experiment("basemodel-experiment-name")

mlflow.pytorch.autolog(
    log_models=True,
    log_every_n_epoch=1,
    log_every_n_step=10,
    )

with mlflow.start_run():
    pretrain(
        config_path="/path/to/fm_config.yaml",
        output_path="/path/to/fm_artefacts/",
        overwrite=True
        )
    try:
        mlflow.log_artifacts(output_path, artifact_path="fm/lightning_checkpoints")
    except Exception as e:
        print(f"Warning: failed to log checkpoints to MLflow: {e}")
Logging semantics in MLflow
This section explains how MLflow records data during BaseModel training, and when you may want to extend the default behavior.
Runs and lifecycle
- Each call to
mlflow.start_run()creates one run under the active experiment. - All metrics, parameters, and artifacts logged within the with block are associated with that run.
- When training finishes, the run is automatically finalized.
with mlflow.start_run(run_name="fm-pretrain"):
    pretrain(...)
Automatic logging (recommended)
When mlflow.pytorch.autolog() is enabled, MLflow automatically captures training signals emitted by PyTorch Lightning. Autologging typically records:
- training and validation metrics
- loss curves
- optimizer state
- the trained PyTorch model (MLflow format)
mlflow.pytorch.autolog(log_models=True)This is the recommended default for BaseModel training workflows.
Manual logging (optional)
Automatic logging can be complemented with explicit logging for values or artifacts that are external to the training loop or domain-specific.
Typical use cases:
- static configuration values
- dataset or foundation model identifiers
- custom artifacts (reports, checkpoints, exports)
| Type | Example |
|---|---|
| parameters | mlflow.log_param("learning_rate", training_params.learning_rate) |
| metrics | mlflow.log_metric("val_loss", 0.123) |
| models | mlflow.pytorch.log_model(model, artifact_path="model") |
| artifacts | mlflow.log_artifacts(checkpoint_dir, artifact_path="checkpoints") |
Use manual logging sparingly—only for signals that are not already covered by autologging or the Lightning logger.
MLflow UI
You can inspect and compare experiments and runs using the MLflow web UI, typically started with:
mlflow ui --backend-store-uri <tracking_uri>and then accessed in a browser (by default at http://127.0.0.1:5000 or http://localhost:5000).
From there you can:
- Browse experiments and runs
- Compare parameters and metrics
- Inspect training curves
- Download models and checkpoints.